What is Uptime Monitoring?
TL;DR
Uptime monitoring is the practice of continuously checking whether a website, server, or API is online and responding correctly. Automated tools send requests every 30 seconds to several minutes from multiple global locations and alert you the moment something fails, usually before your users notice.
Uptime Monitoring: Definition
Uptime monitoring is a service that continuously checks if your website, application, or server is accessible and functioning correctly. It works by sending automated requests to your services at regular intervals from multiple locations worldwide, verifying their availability and performance for your visitors and users.
This continuous monitoring helps you get notified when things go wrong. It acts as a watchdog for your digital presence, ensuring that your services are not just running, but delivering the expected experience to your users. By simulating the connections users make to your services, uptime monitoring provides an early warning system for potential issues before they impact your actual users. Often you will know your site is down before any of your visitors or users do.
At PingPing, we operate a network of monitoring nodes at different locations across the globe. We take care of the technical details, so you don’t have to worry about it.
How Does Uptime Monitoring Work?
Uptime monitoring systems operate through a network of global monitoring servers that perform regular health checks on your services. In case of PingPing, we can send a message to your services every thirty seconds. These monitoring nodes are placed across different geographic locations to provide full coverage of your service’s global availability. Whenever a check fails, we first verify from another geographically distant location to see if the issue is local or global.
The monitoring process begins with sending HTTP/HTTPS requests to your specified endpoints. These requests simulate real user interactions, checking not only if your server responds, but also verifying the response codes to ensure proper functionality. The system can also validate the presence of expected content, confirming that your application is serving the correct information.
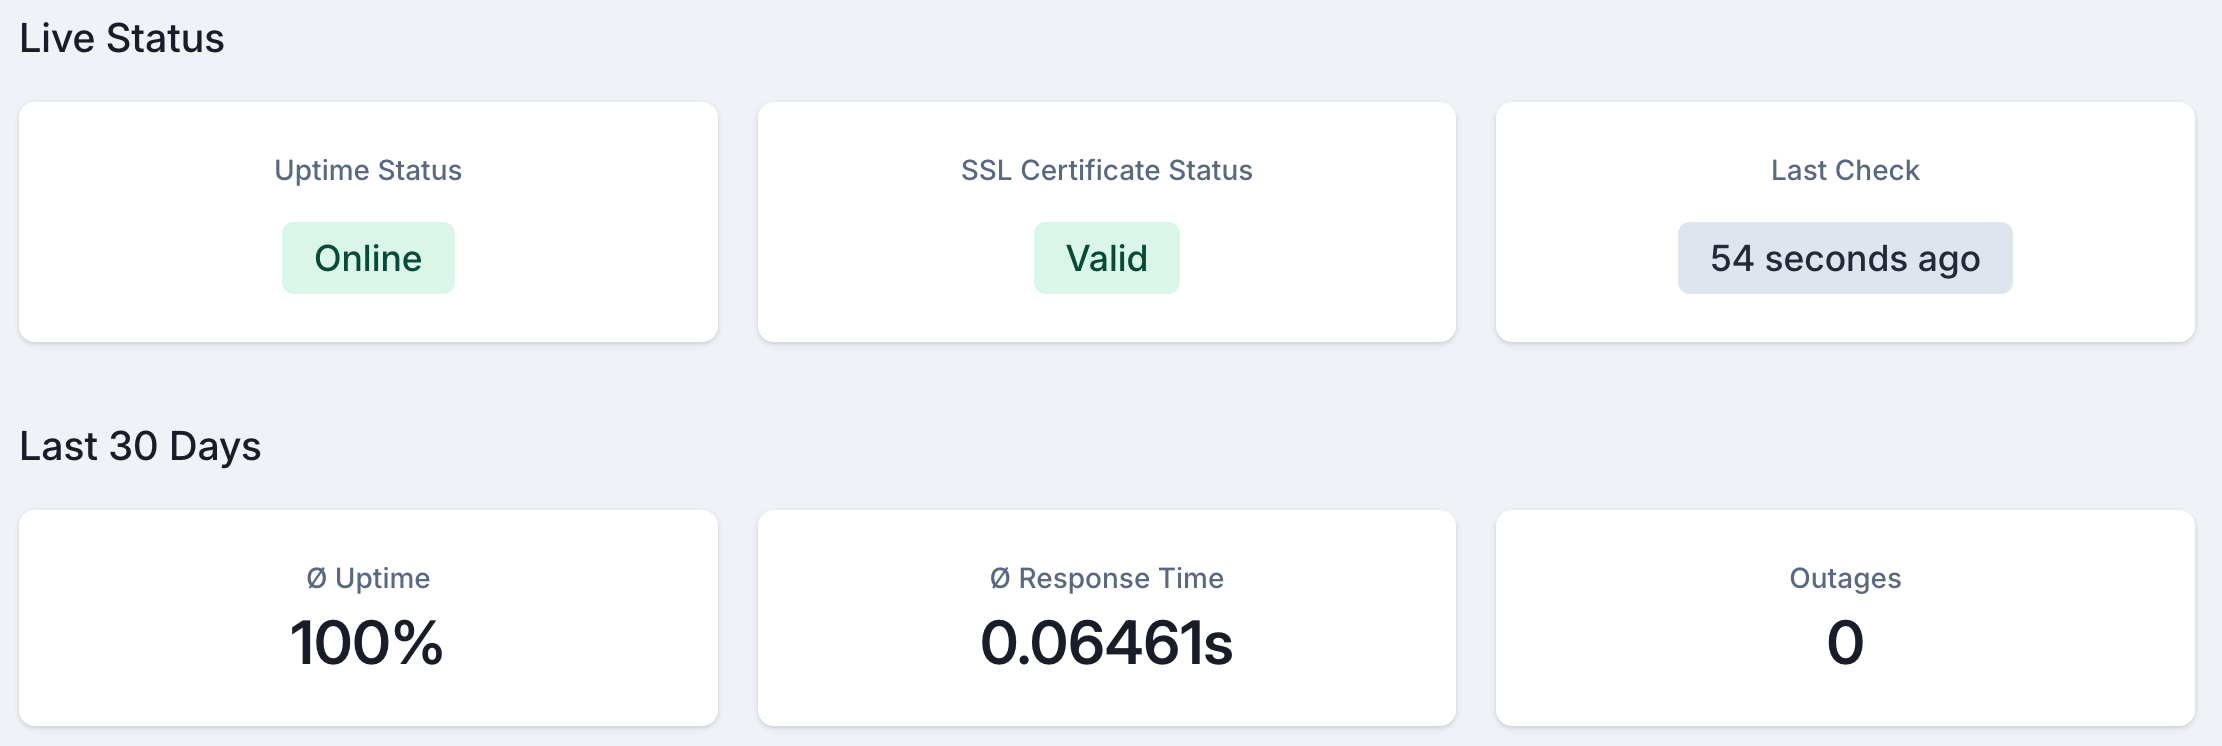
Beyond basic availability checks, PingPing measures response times and validates SSL certificates, giving you a complete picture of your service’s health.

Why is Website Uptime Monitoring Important?
Website downtime has a direct, measurable cost. According to ITIC’s 2024 Hourly Cost of Downtime Survey, 90% of mid-sized and large enterprises report that a single hour of downtime costs more than $300,000; for 41% of those companies, the figure exceeds $1 million per hour. Even for smaller operations, the math is brutal: every minute offline is revenue you’re not collecting, support tickets you’re not answering, and trust you’re not building.
Search engine rankings and SEO performance are particularly vulnerable to downtime. Search engines like Google consider reliability as a ranking factor, and frequent outages can negatively impact your site’s visibility in search results. This decreased visibility can lead to reduced organic traffic and potential customer loss.
Brand reputation takes a hit too. Users expect your site to work every time they visit. When they encounter downtime during a checkout, a signup, or while demoing your product to their boss, that experience sticks. One outage at the wrong moment can cost you a customer who was about to convert.
For business applications, downtime directly impacts employee productivity. When internal tools and systems are unavailable, operations grind to a halt, resulting in lost work hours and frustrated staff. Service outages may also violate Service Level Agreements (SLAs), leading to penalties and damaged business relationships.
Types of Uptime Monitoring
Different services need different types of monitoring. HTTP/HTTPS monitoring forms the foundation, checking your website’s basic availability by verifying that web servers respond correctly to requests. This is the type of monitoring we use at PingPing.
TCP Port monitoring goes deeper, verifying specific service ports for applications like email servers, databases, or custom applications. This ensures that all your service endpoints are accessible and responding correctly. DNS monitoring complements this by ensuring proper domain resolution, preventing navigation issues before they affect users.
For modern web applications, API endpoint monitoring is just as important. It verifies that your APIs are not just available but functioning correctly, maintaining the integrity of your service integrations. Content monitoring takes this further by validating specific page content, confirming your application serves the correct information.
Transaction monitoring goes deepest, testing complete user workflows like login processes or checkout sequences. This catches problems that simpler checks miss, such as a database connection pool that is exhausted only under real load.
Reference
Six types of uptime monitoring
What each layer does, and the failure modes it catches that others miss.
-
HTTP / HTTPS
The foundation
Sends a GET or HEAD request and reads the status code that comes back.
Catches- 5xx errors
- timeouts
- hard outages
-
TCP port
Beyond the web
Opens a socket on a specific port (SMTP, IMAP, SSH, databases).
Catches- mail down
- SSH blocked
- DB unreachable
-
DNS
Resolution health
Queries A, AAAA, MX or CNAME records and checks the answer.
Catches- lapsed domain
- broken NS
- record hijack
-
API endpoint
JSON in, JSON out
POSTs a payload, parses the response, asserts on fields and status.
Catches- broken contracts
- auth failures
- 200-with-error
-
Content match
Right page, right words
Verifies a keyword or string is present (or absent) in the response body.
Catches- defaced pages
- broken templates
- blank checkouts
-
Transaction
A full user journey
Drives a real browser through login, cart, checkout and asserts at each step.
Catches- silent regressions
- broken funnels
- capacity issues
Uptime Server Monitoring Basics
Server uptime monitoring boils down to a few core mechanics:
Checks. A “check” is a single request your monitoring tool sends to your server. The tool records whether the server responded, what HTTP status code came back, and how long the response took.
Check intervals. The shorter the interval between checks, the faster you detect downtime. A 5-minute interval means you might not know about an outage for up to 5 minutes; a 30-second interval cuts that to half a minute. (See our guide on why 5-minute checks aren’t enough for the math.)
HTTP status codes. A 200 response means the server is healthy. 4xx codes signal client-side problems (a broken URL, an auth failure). 5xx codes mean the server itself failed. Good monitoring tools let you define which codes count as “up”. Sometimes a 401 is expected behavior on a protected endpoint.

Retry logic. A single failed check doesn’t always mean your site is down; it might be a transient network blip on the monitoring node’s end. Sensible tools (PingPing included) re-check from a different geographic location before alerting you, which kills 90% of false positives.
Multi-region checks. Running checks from one location only tells you whether your server is reachable from that one place. Distributing checks across regions catches CDN issues, DNS propagation failures, and regional outages that single-location monitoring misses entirely.
Common Causes of Website Downtime
In practice, most outages cluster into a handful of root causes: deploys that ship a broken build or migration, expired SSL certificates that nobody renewed, database overload (connection pool exhaustion, slow queries hitting a cold cache), DNS misconfiguration after a registrar change, and hosting provider incidents that you can’t fix but still get blamed for. Network blips and DDoS attacks make the news but cause far fewer real outages than the first four.
Key Metrics in Uptime Monitoring
Uptime percentage is the fundamental metric, representing your system’s overall availability. A “five nines” (99.999%) uptime has become the gold standard for critical services, allowing for just minutes of downtime per year.
Response time metrics provide insight into your service’s speed and efficiency. This includes the overall response time (how long it takes for your server to complete a request) and Time to First Byte (TTFB), which measures how quickly your server begins sending data. These metrics directly correlate with user experience and satisfaction.
The Apdex (Application Performance Index) score provides a standardized measure of user satisfaction with your application’s performance. It categorizes response times into satisfied, tolerating, and frustrated ranges, giving you a clear picture of the user experience. Error rates complete the picture by tracking the frequency of failed requests, helping identify patterns and potential issues before they become critical.
How PingPing’s Uptime Monitoring Works
PingPing checks your sites every thirty seconds from a global network of monitoring nodes. You can configure notification preferences in your account settings. This frequent monitoring allows for rapid detection of any issues, minimizing potential downtime.
When an issue is detected, our real-time alert system can immediately notify you through one or more channels, including email, SMS, Slack, and other integration options. These alerts include detailed information about the nature of the problem, helping you quickly diagnose and resolve issues.
Beyond basic monitoring, PingPing provides detailed downtime analysis and reporting, helping you understand patterns and prevent future issues. Historical uptime tracking maintains a full record of your service’s performance, while integration with status pages keeps your users informed about your service’s health. See real-world status page examples to understand what effective status communication looks like.
Setting Up Effective Monitoring
Two settings do most of the work: check from multiple regions so a CDN edge problem in Frankfurt doesn’t read as a global outage, and require two consecutive failed checks (from different regions) before paging anyone, so a single dropped packet doesn’t wake you at 3am. Beyond that, you want at least two notification channels (email plus SMS or Slack) so a single inbox outage isn’t a silent monitoring outage. PingPing applies all of these defaults out of the box.
For a deeper look at how different tools handle these defaults, see PingPing vs UptimeRobot and the full comparison hub.
Integrating Uptime Monitoring with DevOps
DevOps teams get the most out of uptime monitoring when they wire it into their incident response workflow. Automated playbooks can trigger initial diagnostics the moment an alert fires, and if the fix is known (say, a runaway process eating memory), the system can restart the service before a human even opens a terminal. That cuts mean time to resolution (MTTR) from minutes to seconds.
Integration with CI/CD pipelines ensures that new deployments don’t negatively impact service availability. Monitoring data can trigger automatic rollbacks if issues are detected, preventing extended outages. Connection with incident management tools streamlines the response process, ensuring that the right team members are notified and involved at the right time.
Over time, monitoring data reveals patterns that pure intuition misses. A gradual increase in response times every Tuesday at 2 PM might point to a scheduled backup job competing for database connections. Spotting that trend early lets you reschedule the backup before it starts causing timeouts during business hours.

Uptime monitoring tells you whether your server responds, but a valid SSL certificate is equally important for your visitors. For a complete overview of how certificate health monitoring works alongside uptime checks, including tool comparisons and setup steps, see our complete guide to SSL certificate monitoring.
Frequently Asked Questions
What is uptime monitoring in simple terms?
Uptime monitoring is an automated service that constantly checks whether your website or app is online. If it goes down, you get an alert (typically within seconds) so you can fix it before users complain.
How does uptime monitoring work?
A monitoring tool sends requests to your website from servers around the world at regular intervals (usually every 30 seconds to 5 minutes). It records whether each request succeeded, how long it took, and what status code came back. If a request fails, the tool re-checks from a different location to confirm the outage before alerting you.
What’s the difference between uptime and downtime monitoring?
They’re two sides of the same coin. Uptime monitoring tracks when your site is available; downtime monitoring tracks when it’s not. Most tools (including PingPing) do both - they measure your uptime percentage and log every downtime event with timestamps and duration.
How often should you check uptime?
For production sites, every 30 seconds is the sensible floor. Five-minute intervals (still common in free tools) mean you can be down for nearly 5 minutes before you even know about it. See our guide on 30-second monitoring for more.
What is a good uptime percentage?
99.9% (“three nines”) is the baseline for most consumer-facing sites and allows about 8.7 hours of downtime per year. 99.99% (“four nines”) allows ~52 minutes/year and is typical for SaaS SLAs. 99.999% (“five nines”) allows ~5 minutes/year and is the standard for mission-critical infrastructure.
Do I need uptime monitoring for a small website?
Yes, arguably more than a large one. Big companies have ops teams watching dashboards 24/7. A solo founder or small business doesn’t. Uptime monitoring is what tells you your site is down at 3 AM so you’re not finding out from an angry customer email the next morning.
What’s the difference between uptime monitoring and synthetic monitoring?
Uptime monitoring confirms your site is reachable and responding. Synthetic monitoring goes further by simulating full user journeys (logging in, adding items to a cart, completing checkout) to catch breakages that a simple HTTP check would miss. Uptime monitoring is a subset of synthetic monitoring.
Ready to stop finding out about downtime from your users? Try PingPing free - 30-second checks from a global network, no credit card required.
Related guides
What is 30-second monitoring?
Why faster check intervals shrink the silent-downtime window, with the detection-math worked through.
Why 5-minute uptime checks aren't enough
The free-tier default that costs you minutes of silent downtime on every incident.
What is uptime and downtime?
The interactive nines table - what 99.9%, 99.99%, and 99.999% actually mean in real downtime minutes.
What happens when an SSL certificate expires?
Browser warnings, API failures, SEO damage, and real-world examples from Microsoft, LinkedIn and Spotify.